A usual method that we usually use to debug the fragments of software code, recognize as well as solve the errors is debugging. Despite the fact that WordPress sites are often working as intended, they are also usually essential to turn on a debugger. In case you use debuggers, you will be able to learn more about how a specific WP plugin works. Such kind of plugin has a possible memory leak and it also helps you to recognize the way that scripts interact with each other as well as whether any improvement could be made or not.
So in this article today, we will talk to you about debugging in WordPress as well as how to debug your WordPress site and some tools for logging errors. Let’s start now!
How to Debug WordPress
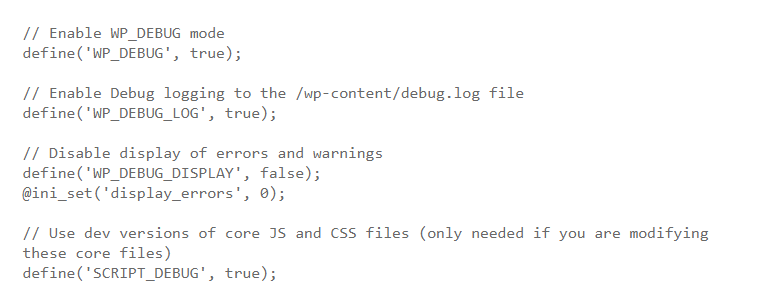
Debugging in WordPress is quite easy. It has a particular coding line that you can insert in your wp-config.php file which will allow debugging in a native manner. If you just only enable WP_DEBUG, it will bring all the error messages out on the screen as well as deter your browsing experience. For this reason, it will be better if you do not do it on a live website as well as log all your DEBUG logs into a different file. Let open your wp-config.php file and then detect a space where to place these following code links:
After putting the above code lines, let save and close the wp-config.php file that you have just edited. The whole of your debugging errors would be logged into a file at /wp-content/debug.log. This method that I have mentioned is easier than showing all errors in the admin dashboard or your own live site.
Several widgets for Debug WordPress site.
Now we will introduce to you another effective way to debug your WordPress site that is using a WordPress plugin or a browser extension. These days, there are hundreds of tools and debugging plugin in the market for you to choose from. But today we will list some of the most popular debug widgets that people usually use.
Firebug is the first tool that I want to introduce to you. By using this tool, developers, designers, as well as webmasters, are able to analyze their own site for design flaws, network issues, possible errors and the functional interaction among languages. If it has fewer errors, your site will load and respond much faster. The reason is that it still takes each error time to conduct and present itself. Moreover, when using this tool, you are able to log all errors in a single place to analyze and fix.
When you know the time each query needs to finish, you can save a lot of time when you optimize your site for maximum performance. Normally webmasters install a lot of plugins with a set of features; however, no one talks about the cost of those features, usually the server memory. Therefore, you need to choose carefully which plugins you need to install for your WP site.
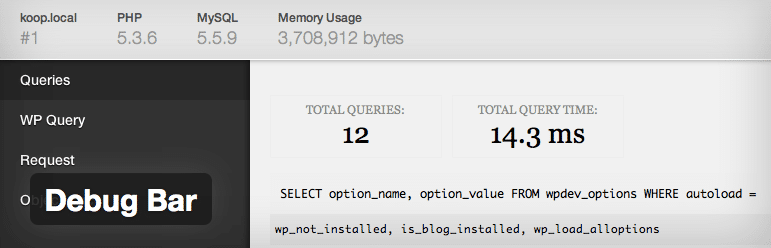
Inserting the Debug bar plugin for your site enables you to die deep into ins and outs of your PHP systems and MySQL. Thanks to it, you can completely understand how querries, data, and scripts interact with each other. Moreover, you can also realize what need to do to enhance and optimize the performance of your WordPress site.
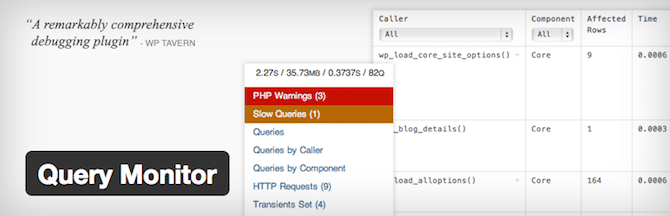
The next one I want to show you is the Query Monitor Plugin. By using it, you are able to debug REST API requests or redirects and AJAX calls as well. Besides, this plugin allows you to examine your filter hooks, database queries and find out PHP errors and so on. You can also get support from a couple of add-ons of other plugins like Debug Bar.
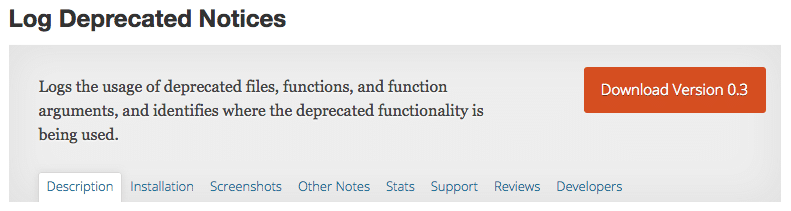
Log Deprecated Notices plugin is a great choice when you use deprecated files, function arguments or functions. This kind of plugin allows you to log and detect the deprecated code as well as provide you an alternation if possible. In addition, you will not need WP_DEBUG mode if you use this plugin.
Debug WordPress is easy
In general, in terms of internal debugging analysis, the Debug Bar plugin is the best choice because it can allow you to determine internal memory leaks as well as many other potential errors. Firebug plugin will be suitable if you need to look at the outside of your WordPress site and the way that the external script and plugins make an effect on the appearance and performance of your site. Whereas, the Default WP_DEBUG mode is suitable enough for you to completely understand the errors of your site and what you need to do. External plugins like what I mentioned above just helps to make it more clear and fix some simple things.
That is all of the articles today. We hope that it can be helpful for you. If having any questions, please leave a comment below we will try to answer as soon as possible.
Welcome to LT Digital Team. We make daily blogs for Joomla! and WordPress CMS, support customers and everyone who has issues with these CMSs and solve any issues with blog instruction posts, trusted by over 1.5 million readers worldwide.
Latest posts by LT Digital Team (Content & Marketing) (see all)
We use cookies to improve your experience on our website. By browsing this website, you agree to our use of cookies.
Functional
Always active
The technical storage or access is strictly necessary for the legitimate purpose of enabling the use of a specific service explicitly requested by the subscriber or user, or for the sole purpose of carrying out the transmission of a communication over an electronic communications network.
Preferences
The technical storage or access is necessary for the legitimate purpose of storing preferences that are not requested by the subscriber or user.
Statistics
The technical storage or access that is used exclusively for statistical purposes.The technical storage or access that is used exclusively for anonymous statistical purposes. Without a subpoena, voluntary compliance on the part of your Internet Service Provider, or additional records from a third party, information stored or retrieved for this purpose alone cannot usually be used to identify you.
Marketing
The technical storage or access is required to create user profiles to send advertising, or to track the user on a website or across several websites for similar marketing purposes.


Recent Comments